Mistakes in Hostile Vehicle Vector Assessments (And How to Avoid Them)
Even well-prepared hostile vehicle vector assessments can contain gaps that create hidden vulnerabilities. This article highlights four mistakes and provides practical guidance on improving accuracy, strengthening mitigation, and avoiding false confidence in existing measures.

Hostile vehicle vector assessments are one of the most critical steps in protecting crowded places, event venues, critical infrastructure, transport hubs and other publicly accessible locations from vehicle-borne threats. Their purpose is straightforward: to identify every realistic pathway a vehicle could use to reach people or assets, and to provide clear, evidence-based input for effective and proportionate mitigation.
Yet assessments – including those prepared by experienced consultants or in-house teams – can still contain gaps that leave sites more vulnerable than they appear on paper. These gaps are not theoretical. Real-world attacks have exploited the same oversights that appear in vector assessments.
The four mistakes outlined below represent consequential issues in hostile vehicle vector assessments. Each one reduces the accuracy of the assessment, underestimates the true range of threats, or creates blind spots that can be exploited with minimal effort. Addressing them systematically is essential for any credible hostile vehicle mitigation strategy.
1. Only considering the main entrance or primary public access point
Many assessments limit analysis to the most obvious vehicle or pedestrian entry – typically the main driveway or drop-off zone. This ignores the large number of secondary and tertiary routes that exist on most sites.
Examples of overlooked pathways include:
Service and delivery access lanes
Emergency vehicle gates
Staff and contractor entrances
Loading docks and waste collection points
Adjacent public roads with direct line-of-sight to pedestrian areas
Uncontrolled grassed or gravel areas that can be driven across
Attackers seek to exploit obvious weaknesses, not obvious entrances. Historical incidents show they frequently select the path of least resistance or the route that permits the highest achievable speed before impact. Restricting analysis to one or two entry points systematically underestimates the number of viable vectors.
An uncontrolled grassed verge may appear impassable during daily operations, yet it can serve as a soft bypass around a heavily fortified main entrance. By using geospatial analysis to assess gradients, soil compaction, kerb heights, and surface conditions, assessors can identify hidden, indirect, or bypass approach paths that allow vehicles to circumvent primary HVM measures.
There is also a less obvious operational consequence worth noting: where search and screening measures are introduced at a primary access point, they create queues. Queues concentrate people. Concentrated people in an unprotected area become a target in their own right, and one that may require HVM provision that did not previously exist. The law of unintended consequences applies directly here: security measures at one point can displace and create vulnerability at another.
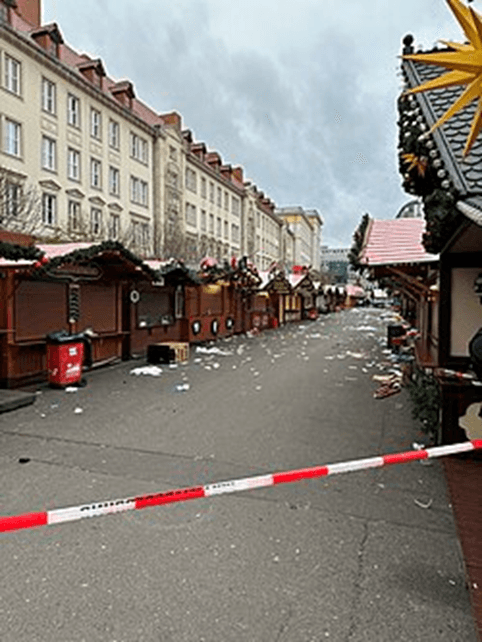
Magdeburg Christmas market attack (2024) - The vehicle entered the market area via an emergency access lane. Image: Olaf2/CC BY-SA 4.0
How to avoid this mistake
Conduct a complete site survey that maps every location where a vehicle could physically reach a crowded area or building façade. Use geospatial tools to trace all possible approach paths from public roads, including those that appear restricted but are not physically blocked. Pay particular attention to access points that are managed operationally rather than secured physically – because operational controls fail. Assess whether security measures at any point create new concentrations of people that themselves require mitigation.
2. Assuming existing measures provide adequate protection
A common assumption is that installed bollards, raised kerbs, or heavy street furniture already provide adequate protection. In practice, many of these measures were installed for traffic calming or urban design purposes, not for hostile vehicle mitigation (HVM).
Frequent issues include:
Bollards spaced wider than 1.2–1.5 m (allowing passenger vehicles or motorcycles through)
Kerbs lower than 100–150 mm (easily mountable at speed)
Non-crash-tested or non-HVM-rated street furniture
Gaps created by removable bollards, gates, or service access points
Degradation or poor installation, including shallow foundations
Surface-mounted elements designed for visual deterrence, not impact resistance.
Many international HVM standards and guidance documents indicate that spacing greater than approximately 1.2 metres may allow passenger vehicle access and therefore requires justification or additional mitigation.
Furthermore, an assessment must look beneath the surface. Many urban bollards are designed for "visual deterrence" or "traffic calming" and are surface-mounted or shallow-set. Without a crash-rated foundation designed to transfer the energy of a vehicle impact into the ground, these elements will simply shear on impact, becoming secondary projectiles.
However, effective hostile vehicle mitigation does not necessarily require overt security infrastructure. When designed well, HVM can be integrated into the urban environment through landscape features and multifunctional street furniture such as seating walls, planters, raised landscaping, or sculptural elements. These features can help shape pedestrian movement, support crowd management, and enhance the public realm while also providing vehicle resistance.
Some of the most effective examples of HVM pre-date the concept entirely. A well-known example is the Queen Victoria Memorial (“the wedding cake”) outside Buckingham Palace. Positioned at the end of The Mall, the monument and surrounding structure interrupt what would otherwise be a long, direct high-speed approach to the palace gates. While designed as a ceremonial landmark rather than a security measure, it demonstrates how large architectural or landscape elements can unintentionally provide highly effective hostile vehicle mitigation.
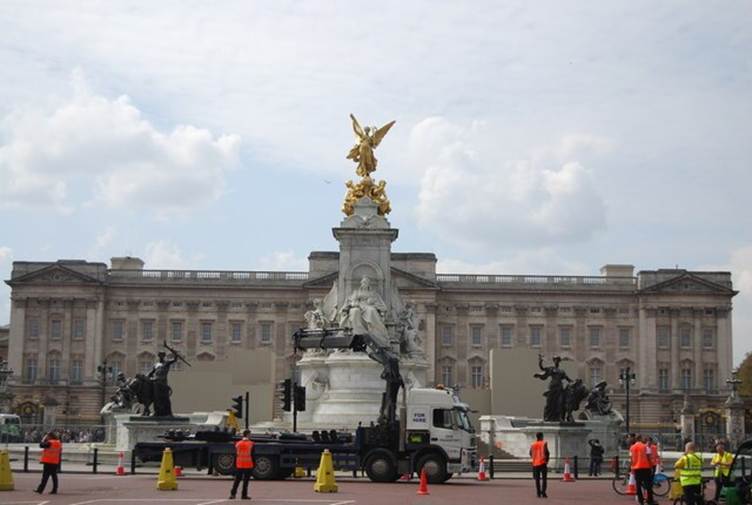
The Queen Victoria Memorial ("the wedding cake") outside Buckingham Palace interrupts the long vehicle approach along The Mall. Image: N Chadwick/Geograph Britain and Ireland (CC BY-SA 2.0)
How to avoid this mistake
Verify the performance specification of each installed element against current HVM standards – PAS 68, ISO 22343 or NPSA guidance. Where no formal test data exists, treat the element as non-protective for hostile vehicle mitigation purposes unless proven otherwise through engineering assessment. Where gaps exist, consider integrated landscape and street furniture solutions that provide mitigation alongside operational and aesthetic function. And treat operationally-managed elements – removable bollards, temporary barriers, police vehicle placements – as contingent controls, not as primary physical mitigation.
3. Neglecting or underestimating standoff distance
Some assessments focus primarily on the stopping capability of barriers at the point of impact but give insufficient attention to standoff distance – the separation between the barrier line (or predicted vehicle stopping point) and crowded areas, building façades or critical assets.
Effective standoff should be measured from the predicted final stopping point of the vehicle, not the barrier line itself. Penetration distance, dynamic deflection and vehicle override behaviour must therefore be considered when determining true separation from the protected area.
In dense urban environments, large standoff distances are often difficult or impossible to achieve due to space constraints, operational requirements or existing infrastructure. The mistake is not the absence of distance itself but failing to recognise the consequences of limited separation and failing to compensate for it through barrier placement, site layout or layered mitigation measures.
Common oversights include:
Positioning barriers too close to crowded zones or building facades without assessing the consequences of the resulting limited separation
Evaluating barrier performance only against stopping criteria without measuring predicted post-impact penetration or deflection distances
Not using existing site features (setbacks, landscaping, adjacent roads or changes in level) to increase effective standoff
Failing to reassess standoff distance when site layout, roadworks, or event setups alter approach paths or available separation.
Neglecting adequate standoff distance leaves sites exposed to greater harm from vehicle-as-a-weapon attacks. Where long, unobstructed approach paths exist, vehicles can achieve higher speeds before reaching the barrier line, resulting in significantly higher kinetic energy (KE = ½mv²). Because velocity is squared in the formula, even a small increase in speed produces a disproportionate increase in impact force. A vehicle travelling at 60 km/h carries approximately four times the impact energy of the same vehicle at 30 km/h. Even modest increases in achievable speed substantially increase penetration potential, structural loading and injury severity.
Longer uninterrupted run-up distances allow vehicles to reach higher speeds before impact. Where barriers are positioned directly at the target line, vehicles may arrive at maximum achievable velocity. Although a barrier may perform to its certified rating and prevent breach, higher approach speeds increase:
Load transfer into foundations and supporting structures
Risk of barrier displacement or localised structural failure
Vehicle fragmentation and secondary debris hazard
Residual kinetic effects within the immediate impact zone
Barrier performance therefore cannot be separated from placement. A compliant barrier positioned too close to the asset may stop the vehicle but still allow harmful impact effects at the target line.
Where a vehicle-borne improvised explosive device (VBIED) is present, standoff distance becomes even more critical. Blast overpressure reduces rapidly with increasing separation according to scaled-distance principles. Increasing the distance between detonation point and protected area reduces:
Peak reflected overpressure at façades
Structural impulse loading
Fragment density and penetration risk
Glass break probability and secondary injury
Even tens of metres can materially alter blast effects. A barrier placed directly adjacent to a crowded façade concentrates blast effects at the point of occupancy. Increasing standoff distance significantly reduces blast overpressure and fragment hazard.
Standoff distance strongly influences the time available for detection and intervention. At 60 km/h (16.7 m/s), time to target can be estimated using t = d / v:
20 m provides approximately 1.2 seconds
50 m provides approximately 3.0 seconds
80 m provides approximately 4.8 seconds
These are the approximate windows available to spot the threat (via radar, camera, visual observation, etc.), decide on a response, and execute an intervention before impact or detonation. In real-world scenarios (especially high-threat environments like checkpoints, convoys, or urban security), even a few extra seconds from greater standoff can be critical, as human or automated reaction times often require 2–5+ seconds for reliable detection-to-action cycles. Shorter times (like 1.2 s at 20 m) leave almost no practical margin for effective countermeasures.
Insufficient standoff often forces reliance on higher-rated and more expensive barrier systems installed close to the asset. By contrast, increasing separation through earlier barrier placement, traffic calming, chicanes or landscape offsets can reduce achievable approach speed, lower structural demand and expand response options. Distance functions as both a physical and temporal mitigation measure.
Increasing separation reduces achievable impact energy and increases available response time.
How to avoid this mistake
Include standoff distance as a standard parameter in every vector assessment. For each realistic approach path, measure the achievable standoff distance from public roads to the protected area, accounting for barrier placement, predicted penetration and deflection distances (using data from PAS 68, or ISO 22343), site geometry and post-impact vehicle behaviour. Identify opportunities to increase separation by positioning barriers or traffic calming features (chicanes, offsets, speed tables) further from the target, and by integrating landscape elements (planters, seating, trees, berms) that extend standoff without relying solely on engineered barriers. Calculate the reduction in kinetic energy and impact severity for each additional metre of standoff as part of the evidence base for barrier performance decisions. Reassess whenever site modifications, road changes, or event configurations alter available approach paths.
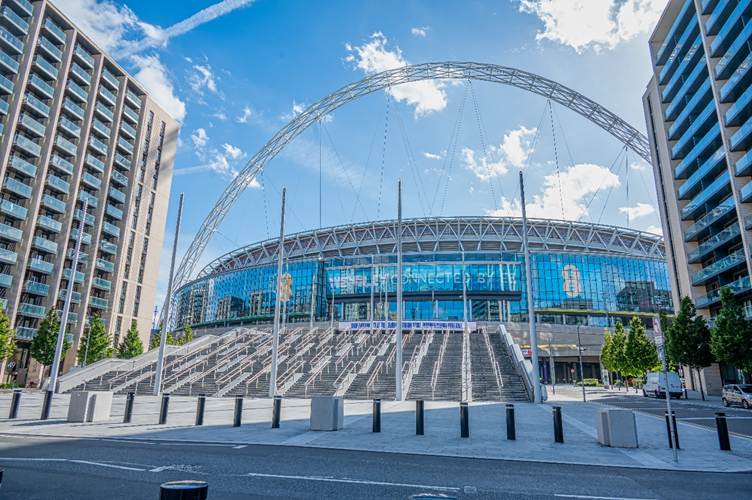
Vehicle exclusion line that separates traffic routes from large pedestrian areas at Wembley Stadium. Editorial image © russell102 / stock.adobe.com
4. Treating the assessment as a one-off document rather than a living process
Many organisations complete a vehicle vector assessment once (often to satisfy a tender, insurance, or regulatory requirement) and file it away. Threat tactics, site layouts, surrounding road networks, and vehicle types change over time. An assessment that was accurate at the time it was written may be materially out of date within months.
Common consequences include:
New temporary structures or event layouts creating previously unanalysed vectors
Roadworks or nearby developments altering approach paths
Changes in vehicle rental practices or available vehicle types
Evolving attack methodologies observed in recent incidents
The Bourbon Street attack in New Orleans on 1 January 2025 highlights the risks of gaps between identified vulnerabilities and implemented mitigation. A 2019 security review had already identified weaknesses in the French Quarter’s bollard system and recommended improvements. The city later began replacing the ageing infrastructure, but the system was not fully operational at the time of the attack, creating a temporary security gap. The attacker drove a rented pickup truck onto the sidewalk, bypassed a police vehicle used as a traffic control measure, and entered a crowded pedestrian area.

CCTV still showing the vehicle involved in the January 1, 2025, New Orleans vehicle attack. Image: public domain CCTV footage recorded by Krystal on Bourbon Street.
How to avoid this mistake
Treat the assessment as a living document. Schedule periodic reviews (at minimum annually, or after significant site, operational or threat changes). Ensure that findings and recommendations are formally handed over when personnel or contracts change. Use tools that allow rapid re-modelling when new information, new incident data, or site modifications become available.
Conclusion
Accurate hostile vehicle vector assessments require comprehensive site coverage, realistic vehicle modelling, verification of existing measures, inclusion of all access routes, and ongoing review. Errors in any of these areas can lead to misplaced confidence or poorly targeted security investment.
Effective assessments should also consider detection opportunities, response timelines, the potential for layered or follow-on attacks, and the operational procedures that mitigation depends on – because physical measures and operational controls only work as a system.
If your current process relies primarily on manual drawings, spreadsheets, or static reports, consider whether it is capable of identifying the issues described above.
AHVVA
Assess Threat’s AHVVA software automates key elements of hostile vehicle vector assessment by systematically modelling multiple vehicle classes, vehicle approach paths, and achievable approach speeds to enable faster and more complete vector identification.
To support evaluation of mitigation measures, AHVVA also includes a vehicle safety barrier performance matrix that compares predicted vehicle impact conditions, including vehicle class, speed, and kinetic energy, with recognised barrier performance categories. This helps determine whether existing or proposed mitigation measures are appropriately matched to identified vehicle vectors and reduces reliance on visual assumptions about barrier effectiveness.
For more information about AHVVA, click here